Big Data for Cinegy Logging and Analytics
Reading time ~9 minutes
As a software provider, we’ve always directed our customers to make the best use of available tooling normally found inside any Enterprise IT deployment for managing their environment. Many technologies have come (and some have gone) for tracking problems and for maintaining a healthy environment. Some fantastic products exist, such as SolarWinds for general IT or iControl from Miranda for broadcast, and these can help make managing an environment much easier. We understood that the Cinegy platform does not exist in isolation, and we never tried to force yet another management tool onto customers for working with our software.
However, times change, and scales just keep increasing. Supporting our customers becomes more complex as we have more products and they carry out ever more advanced tasks. Couple this with our plans to help customers by implementing more Cinegy software in the cloud to run "Cinegy as a Service", then we needed to consider changing the model. We’ve also seen that an increased transition to IP is triggering more problems, which get pushed to Cinegy (even when this is not actually our fault – but the net result of "the Cinegy stuff isn’t working" is obviously not ideal).
Basically, we need insights.
Technology to the Rescue
We considered what to do, and one big thing has changed since we last took a serious look at this area. In a great many cases now, we can assume that our customers have at least some basic, reliable Internet access. Now, it may be that some systems will be firewalled away (a sensible precaution in many cases), but even in these cases, we should be able to access some "bridging" machine. Some systems, I’m sure, will not be able to "see the cloud" – and thus, for these systems, we will need different thinking. However, such cases are now much smaller than in the past – so we decided to see what we could do to use the Internet to centralize the task.
The benefit of this being hosted "in the cloud" is simplified administration and access – and the ability for customers to use this system immediately and transparently without deployment effort on their part (a big win for many). It also means we, as a provider, can move much quicker to bring this service live – it takes a lot of effort to wrap up software as a shrink-wrapped (even virtually shrink-wrapped) product. If we can skip this step, we can get more value to more people quicker – and if we don’t close any doors for people that need on-premises deployment, they can still work in this way, it’ll probably just be a bit behind the curve and cost more to get deployed. I should add, though, it will be no more behind the curve, and no more expensive than if we didn’t adopt this cloud-first strategy; but it will just have a more obvious contrast against the backdrop of the faster, ready, and waiting cloud service…
So, at Cinegy, we selected some software, and then we started selecting some core properties of use of this software. We have therefore decided on a few points:
JSON Data Logging Format
JSON data is the native format of the cloud (it’s just a JavaScript object with values written into it), and using this format is lighter, smaller and quicker than XML. Everything we move and everything we store is in JSON.
Log File Unification Program
We’ve developed many products over many years, with many people using many technologies. We need to start bringing the myriad ways these products write things into log files into harmony. The semantic meaning of words should be fixed across products, and the log structures should have a common base, which makes designing viewers for these logs simpler.
Centralized Log Harvesting with Big-Data Technology
The beating heart of the project – we have created a giant cloudy bucket (or more accurately, a massive array of many buckets) which customers can push their logs into. We can then query, catalogue, and display data from these buckets. This has become much easier in the last few years thanks to advances in technologies in this space, and we’re loving it. The software we have deployed for this is ElasticSearch with some custom development to secure the inflow of customer data and to block any external access to that data.
HTML5 Rich Dashboards for Analysis and Security
To misquote Shakespeare – "All the world’s a stage, and all the men and women use a browser to access important information". Everything these days runs in a browser, and so to do anything otherwise here would be annoying. Therefore, we looked around and found a great HTML5 portal called Grafana to deliver a brilliant experience to customers. This is deployed inside our telemetry cluster, and allows us to secure customer data by organization ID – customers share the same giant cluster, but all customers are only able to access data marked with their organization "tag" thanks to the Grafana backend enforcing filtering of our buckets.
Our approach to telemetry helps customers understand our collection limits – not only do we explain how our telemetry works, but we also provide customers direct access to the exact data we store. We have no access to any data we don’t share back with you (in real time!); so, if you don’t like the level of information sharing, you can make an informed opt-in or opt-out decision.
Cloud Connectivity to Avoid Customer Rollout Complexity
As we mentioned before, we decided to take the plunge into assuming cloud connectivity exists for a customer. We’ve been wary of making this step before, but it was either do this and go live in 2017 or be traditional and be lucky to have only a year’s delay. We also figured that truly centralized logging without the Internet would be hard to implement…
What Have We Made?
So, we got to work and did some hardware and software installation. We created a big-data cluster and set up some firewalls. Now we have our massive array of data buckets, and we have a front-end to visualize that data. What next? Well – we decided to take a scenario-based approach and work with some tools we use a lot internally for development and test – our open-source TS Analyzer tool and our Multiviewer. After extending these tools to write their logs up to our cloud (for the interested, we use the NLog ElasticSearch extension to allow our log data to flow to the telemetry cloud we set up), we looked at our results.
Let’s now look at the user experience so far – here is what you’ll be greeted with when you arrive at our new front-end portal:
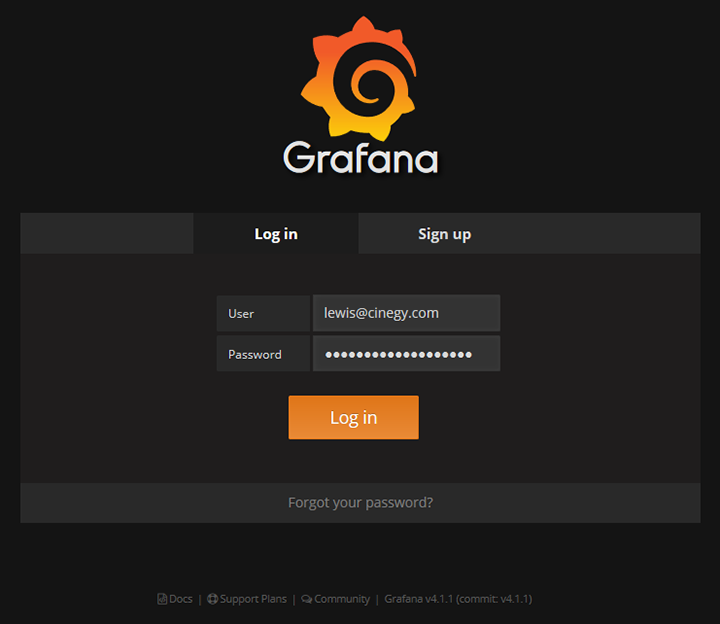
You can sign up (right now – try it!) and access our default "welcome" organization. From here, you will need to contact someone at Cinegy to get added to the correct organization. If you are interested in joining our early access program, please contact our sales team and ask to be put in contact with the team running this.
Once you are added to an organization, the fun starts. You should be able to see your organizations here (I’m a member of a few – and have access to some "admin" elements normal humans won’t be able to see):
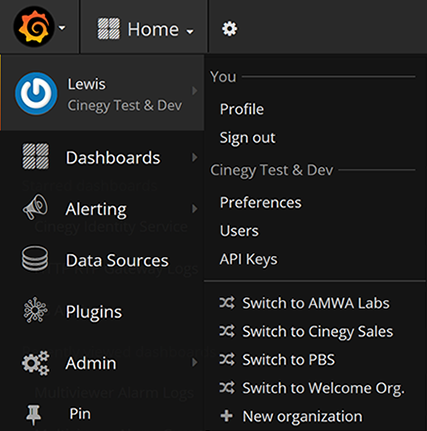
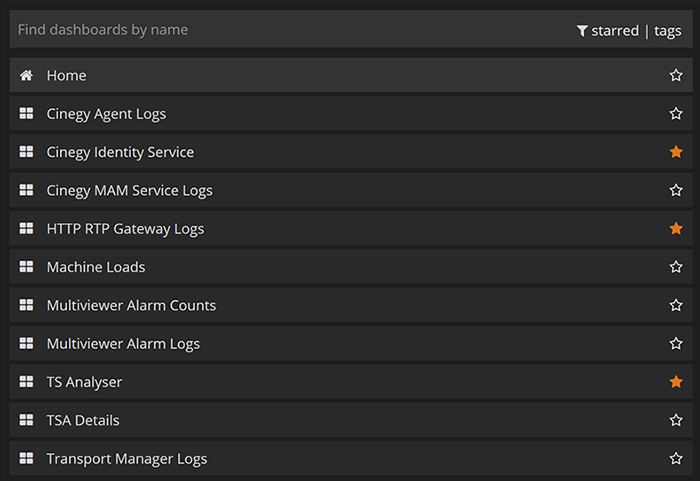
Switching away from the "Welcome Org." allows you to see what dashboards have been pre-created. Our internal organization has quite a list already – you can access such a list by clicking "Dashboards" in the above menu, or by hitting "Home" on the top row.
Now, with a front end available, and hopefully some data logged into our buckets and connected via a data source, we can view something that looks similar to our traditional logging, but in a nice HTML grid:
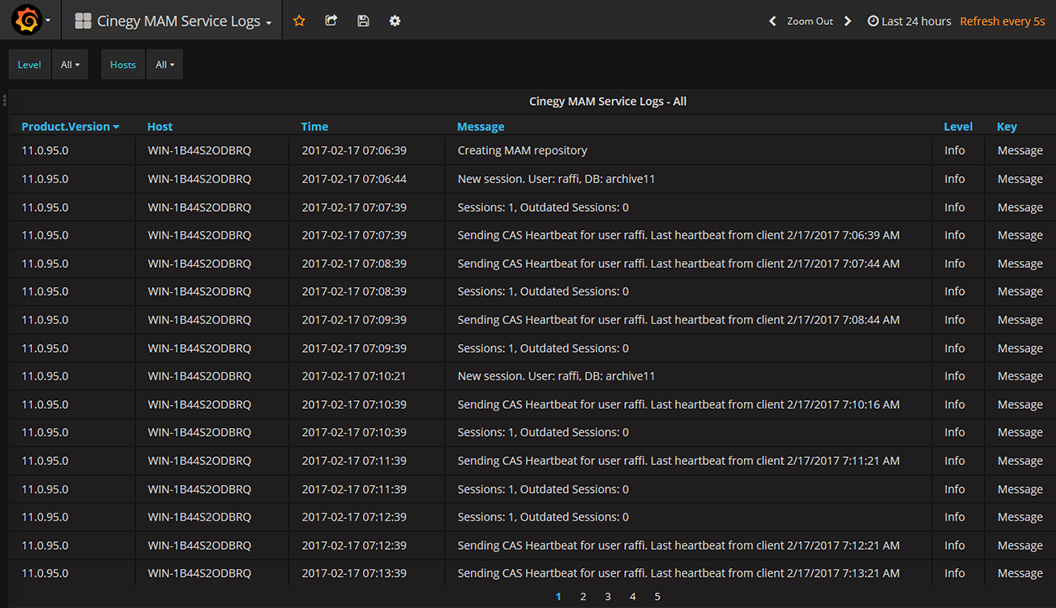
Above, you can see the logging from our new RESTful MAM service – we can filter by level and by host machine, which makes it very easy to run through. We can also define specific times to review – no more working out which log file corresponds to which period – we can filter a whole month of logs at once.
However, after we did this, we realized we are just starting our journey… we realized the real power here comes not just from making entries into the panel for log events, but generating all new regular interval metrics at regular intervals – time-sliced data. An example of this is best seen with the feature of Cinegy Multiviewer – we slice up the maximum and minimum loudness values seen every few seconds, and then use the great charting features to explore the momentary loudness of a channel. For example, here is an evening of BBC One HD output last week:
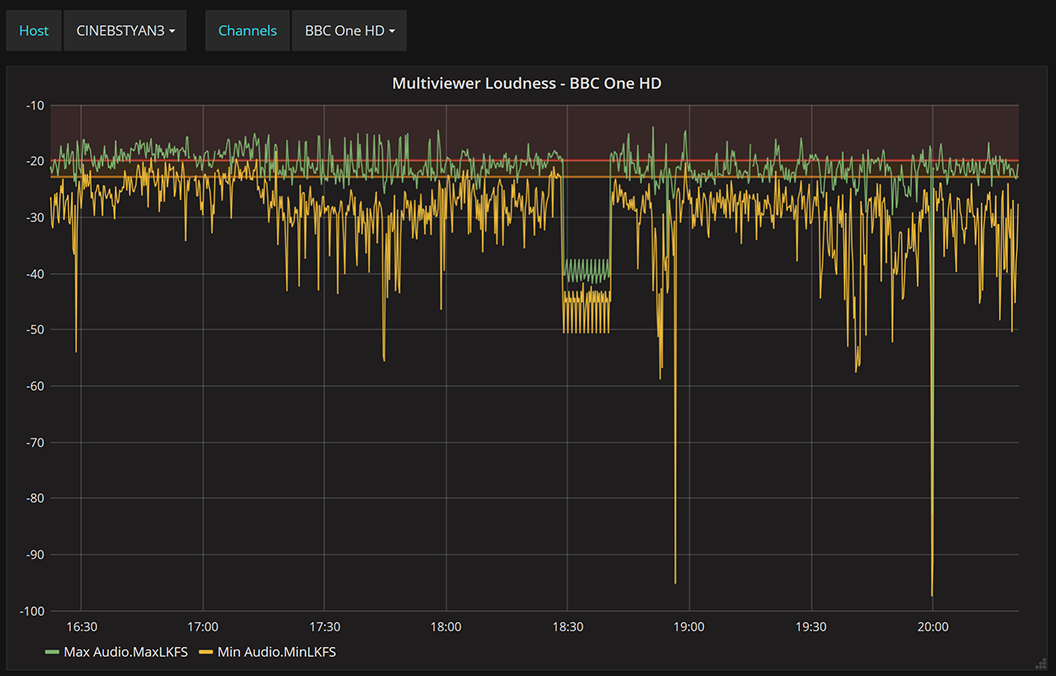
What is great about this is that we can now see how far above a threshold loudness might travel, as well as how low. We can see the clear break at 18:30 where the local news is pushed into the transmission (but only in SD, so this circuit plays a quiet placeholder clip in place), and we can see values relative to some guidelines (orange is -23LKFS, and red is -20LKFS).
Such graphing is addictive, so we added it to the open-source TS Analyzer we make (get it here – compiled EXE links are at the bottom of that page):
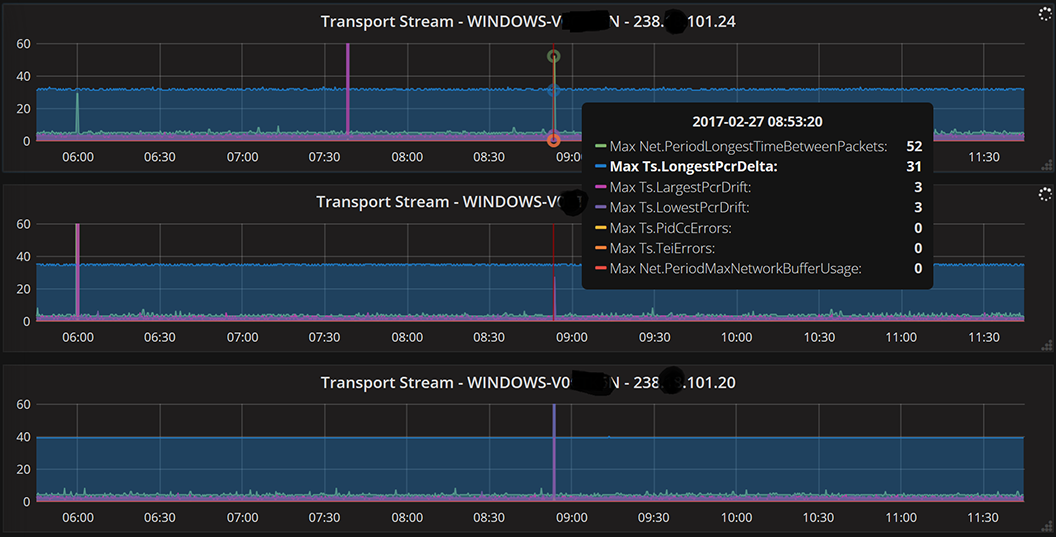
Here we can see lots of details about packets, jitter, and faults – I have set the cross-hairs to a point where there was likely a network problem, and you can see 3 streams share a "spike" at the same moment (and registered some jitter of 52 ms on the top stream).
You can expect a lot more of our tools to offer not just telemetry of logging, but more varied insights are possible once you start considering "time slicing" data to draw nice graphs!
What’s Next
Rollout to customers – we’re ready to start a pilot program to let customers jump on and start using this. As mentioned above, sign up on the portal and then contact the sales team to get in touch with the relevant people. You can use the open-source TS Analyzer right now, and we suggest Cinegy Multiviewer, which will let you trial the telemetry from this product with just a couple of clicks of a button!
Of course, then we’ll begin the long road of integrating such telemetry into our other products – it’s a journey that will take a while, but we certainly hope it’s a journey worth taking!