Engines Panel
Reading time ~3 minutes
All the monitored Cinegy Capture engines are displayed in thumbnail representation on the engines panel:
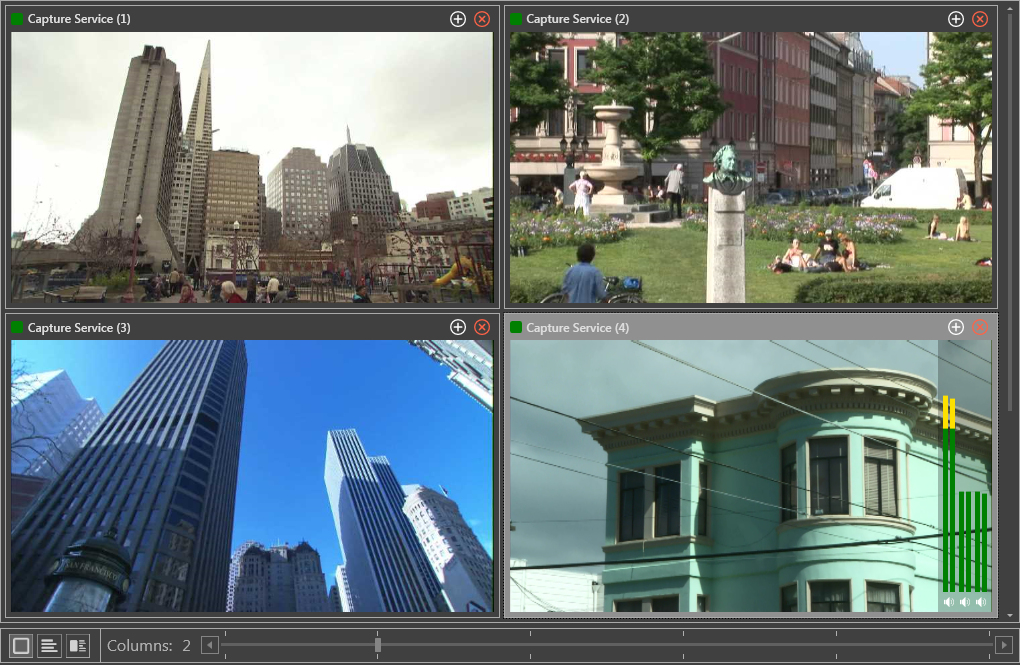
Cinegy Capture engines can be displayed in three different modes, which can be switched using the corresponding buttons on the toolbar in the engine preview area:
|
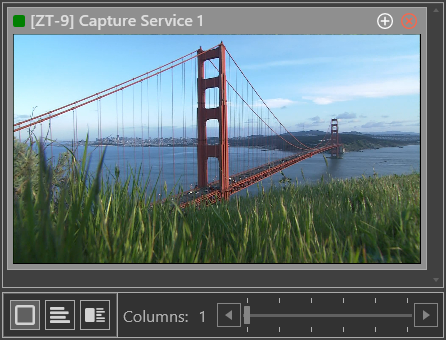
Preview mode – in this mode, video previews from the engines are displayed: |
|
|
|
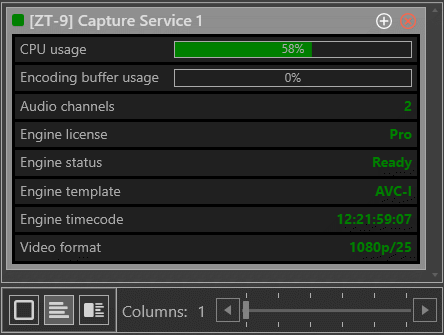
Detailed dashboard mode – in this mode, detailed info about the engine along with the video preview is available: |
|
|
|
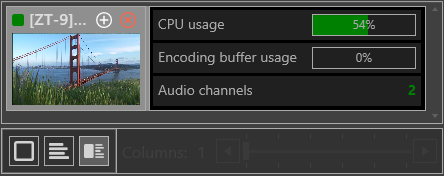
Compact dashboard mode – in this mode, the same engine instance is displayed, but there is some information instead of the video preview: |
|
It is possible to adjust the thumbnail size by specifying the number of columns with engine instances to be displayed:

|
Note
|
Column adjustment is not available in compact dashboard mode. |
Engine Management
The engine caption displays the engine status and name. If the name is long and doesn’t fit the caption area, hover the mouse pointer over the caption to display the tooltip with the full name:
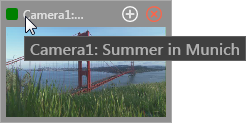
The caption also contains the following buttons for engine management:
|
Pressing this button forces adding the engine to the group of active engines. |
|
This button disconnects the corresponding Cinegy Capture engine service and removes the engine from the engines panel. |
Preview Mode
In this mode, the video preview for each Cinegy Capture engine is displayed. By default, the low-frame-rate preview for Cinegy Capture engines is displayed at a rate of 1 frame per second to minimize network traffic and CPU usage. However, if one or several preview streams are configured and enabled for the engine in Cinegy Capture Manager, you can activate real-time preview:
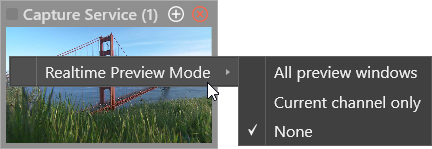
When real-time mode is activated, the context menu provides additional options for preview setup, activation of audio indicators, and deinterlacing settings:
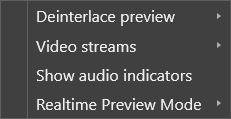
|
Important
|
For more details on these options, refer to the Main Preview Panel article. |
Compact Dashboard Mode
In this mode, instead of a stream preview, the most important information about the engine and ingest status is displayed:

The dashboard size is controlled in the same way as in Preview mode – by the columns bar. The number of rows may vary depending on the preview size. If the size becomes too small to display the information, it shows nothing.
Detailed Dashboard Mode
In this mode, both the video preview and additional information for the engine are available. The panel displays a list of dashboard elements, one engine per row:
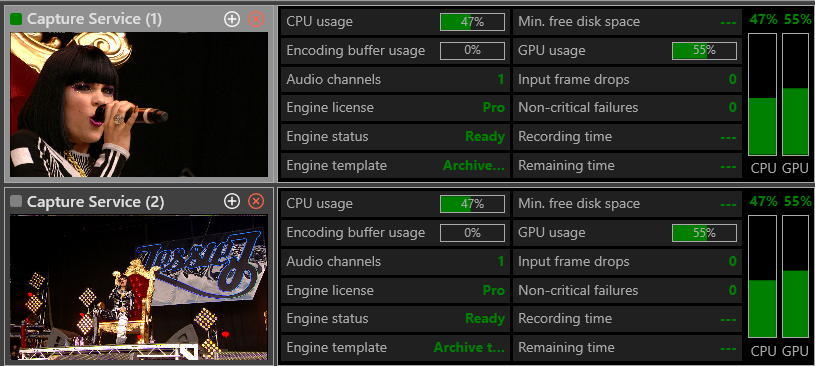
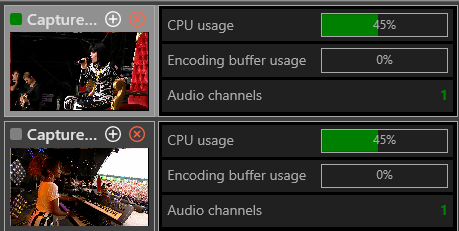
The layout can be automatically adjusted according to the panel size, which can be changed by the zoom bar or by the width of the preview panel. In this case, CPU/GPU meters are hidden, and the right info column disappears:
Additional Details
|
Important
|
For a detailed description of configuration parameters refer to the Dashboard configuration tab. |
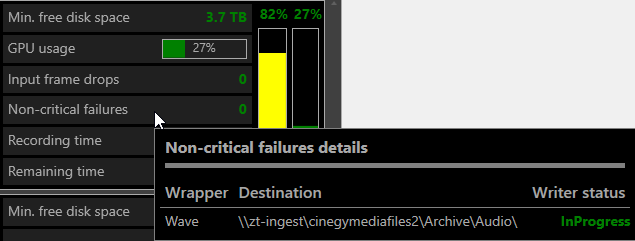
Each dashboard "cell" can have some additional details to display in certain cases. For example, if the "File write errors" field shows some errors, it is possible to see which output had the problem, etc.
Every individual cell can be highlighted by hovering the mouse, the left click will open the form with additional details (if any):
